Validation of picogram- and femtogram-input DNA libraries for microscale metagenomics
Validation of picogram- and femtogram-input DNA libraries for microscale metagenomics
High-throughput sequencing libraries are typically limited by the requirement for nanograms to micrograms of input DNA. This bottleneck impedes the microscale analysis of ecosystems and the exploration of low biomass samples. Current methods for amplifying environmental DNA to bypass this bottleneck introduce considerable bias into metagenomic profiles. Here we describe and validate a simple modification of the Illumina Nextera XT DNA library preparation kit which allows creation of shotgun libraries from sub-nanogram amounts of input DNA. Community composition was reproducible down to 100 fg of input DNA based on analysis of a mock community comprising 54 phylogenetically diverse Bacteria and Archaea. The main technical issues with the low input libraries were a greater potential for contamination, limited DNA complexity which has a direct effect on assembly and binning, and an associated higher percentage of read duplicates. We recommend a lower limit of 1 pg (∼100–1,000 microbial cells) to ensure community composition fidelity, and the inclusion of negative controls to identify reagent-specific contaminants. Applying the approach to marine surface water, pronounced differences were observed between bacterial community profiles of microliter volume samples, which we attribute to biological variation. This result is consistent with expected microscale patchiness in marine communities. We thus envision that our benchmarked, slightly modified low input DNA protocol will be beneficial for microscale and low biomass metagenomics.
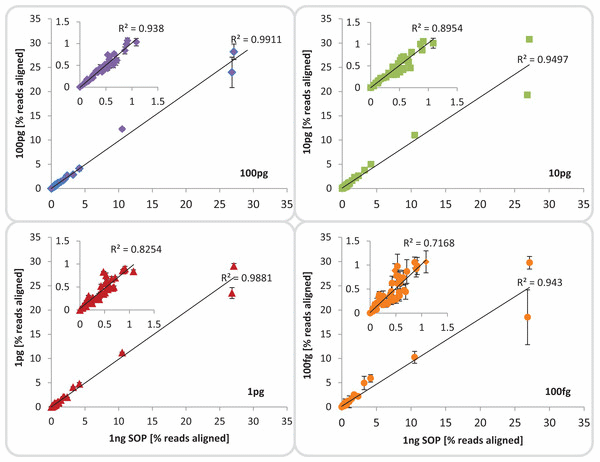
Figure 3: Mock community profile comparisons. Correlation between the 1 ng SOP libraries (x-axes) and the low input DNA libraries (100, 10 and 1 pg, 100 fg; y-axes). Shown is the mean relative abundance of the 54 mock community members, based on reads aligned to the respective reference genomes.Inserts: show a subset of the relative abundances excluding the five most dominant organisms of the mock community. The mean standard deviation for each library is provided as error bars. The 100 fg libraries include four replicates (1, 2, 4, 5) out of five, omitting replicate 3 which was highly contaminated.

